
- Good News


Vincent Bongolan
Apr 06,2021
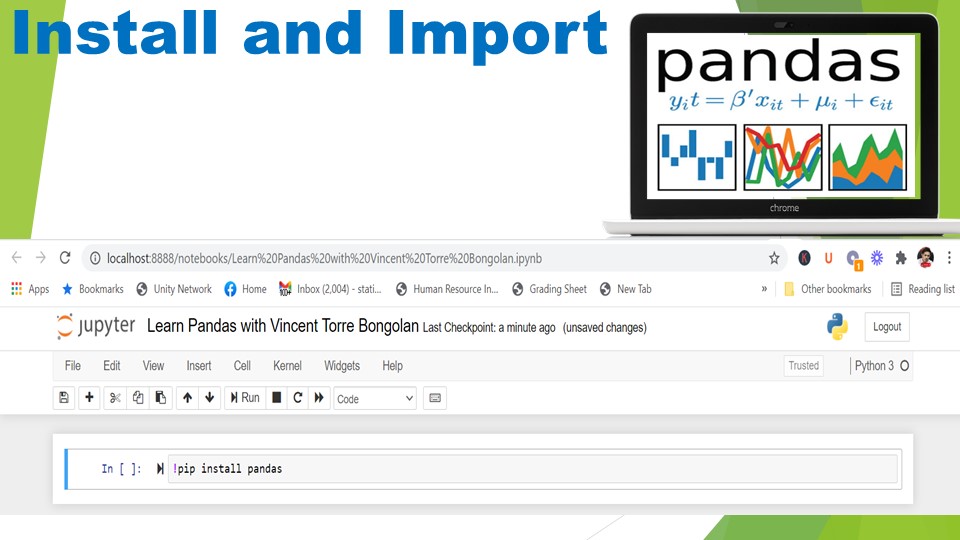
Free Lesson about Learning Pandas in used in Data Science
Imagine having this DataFrame and like I said, in Pandas you can clean data, transform, and analyze. You can easily inspect or see if there are wrong in the data such as code, spelling, and any typographical error. Once you perform Exploratory Data Analysis, you can now calculate basic measures of Central Tendency or Measures of Variability in the data such as.
1.	Exploratory Data Analysis
a.	Check the missing value.
b.	Check the outliers.
c.	Check the spelling.
d.	Incorrect input
2.	Transformation of the Data
a.	Perform Data Transformation such as Log, Inverse, Square Root, etc.
3.	Measures of Central Tendency
a.	Mean
b.	Median
c.	Mode
4.	Measures of Variability
a.	Range
b.	Variance
c.	Standard Deviation
5.	Degree of Association
a.	Correlation
6.	Determine the Distribution of the Data
a.	Binomial
b.	Poisson
c.	Normal
7.	Visualization of the Data
a.	You can visualize the data with the use of Matplotlib, plot bar, lines, histograms, etc.

1 Comments
-
 You Totally CanApr 23, 2021 22:58wow :)
Check Out More Good News


"Quezon" Official Trailer | Reaction Video
Aug 25,2025


Comments